
Usage & Metrics
See how your AI assistant is using DataToRAG: calls, latency, errors, and per-tool breakdowns.
Every tool call your AI assistant makes through DataToRAG is logged to your personal usage dashboard at datatorag.com/dashboard/usage. You can see what ran, how fast it was, and where errors are happening.
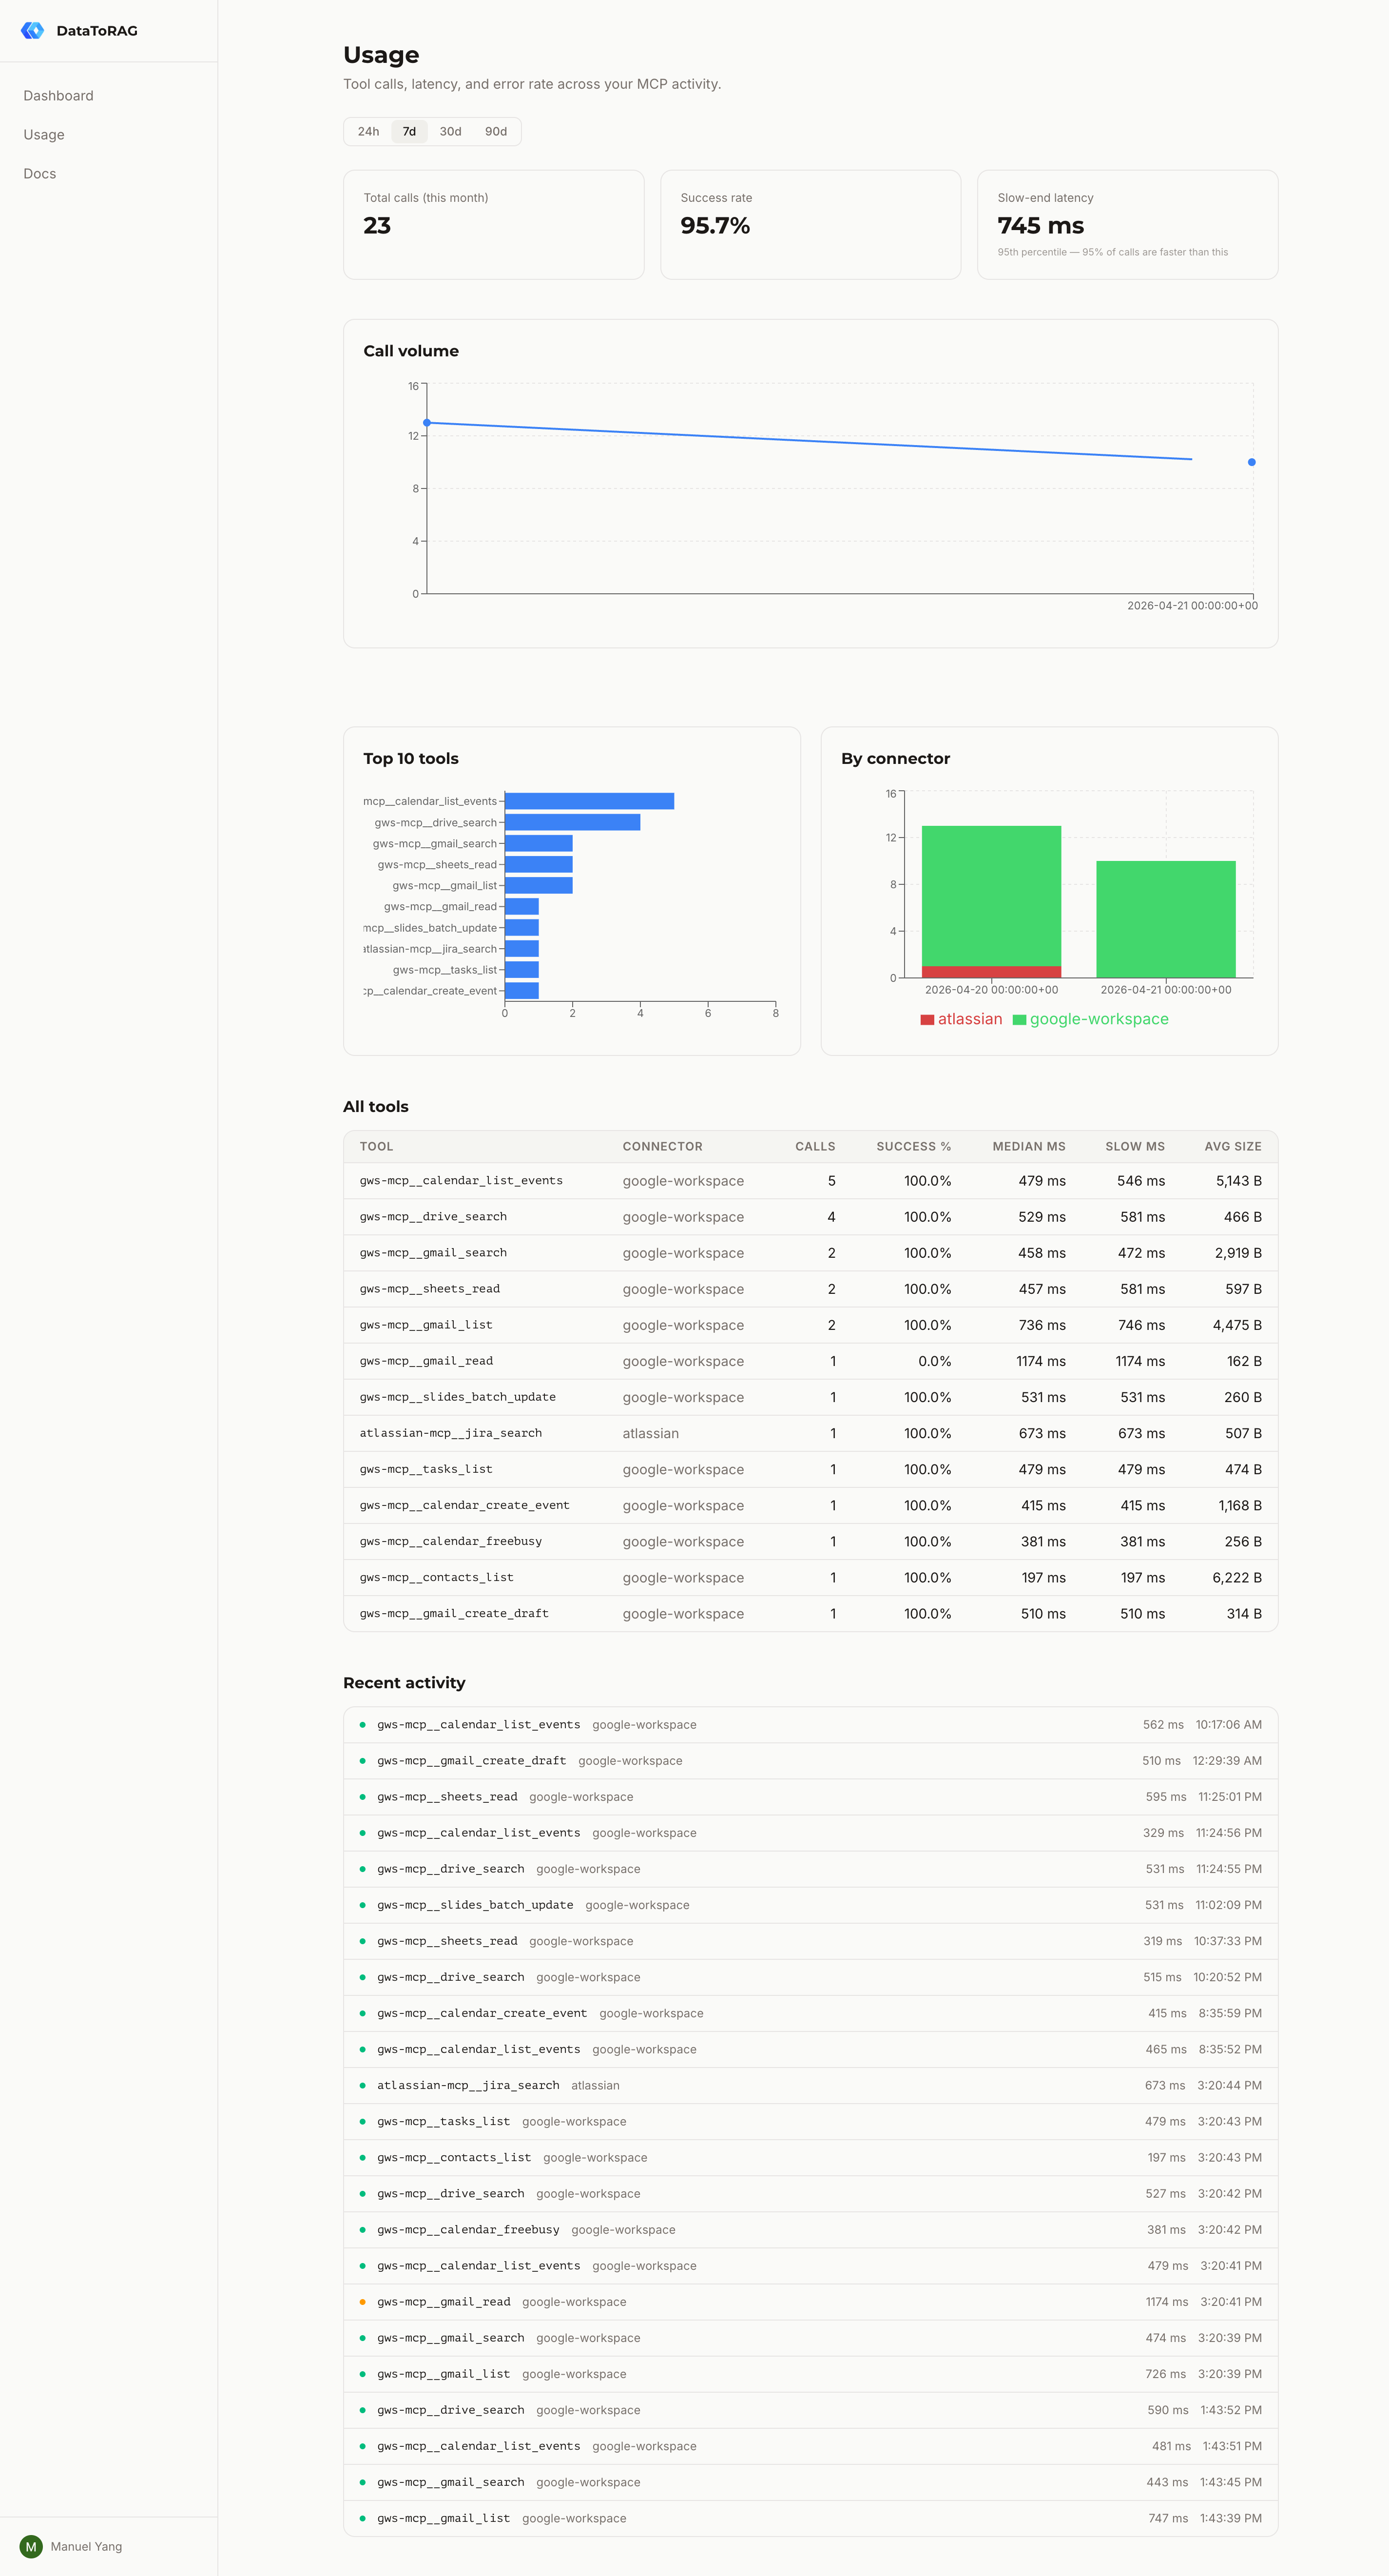
What you see
The dashboard shows four things:
- Summary cards: total calls this month, success rate, median latency, and slow-end latency (the p95, the speed you get on a bad day)
- Call volume over time: hourly buckets for 24h and 7d ranges, daily for 30d and 90d
- By connector: stacked breakdown of calls across Google Workspace, Atlassian, and anything else you've connected
- Per-tool table: every tool you've called, with call count, error count, and median latency. Click a row to drill down
The drill-down page shows the last 50 calls for a single tool: when it ran, the status, latency, and any error message.
What gets logged
For every tool call we record the tool name, connector, outcome (success / user error / server error), latency, and response size. We log when a call happened but not what it did, and arguments and responses are never stored.
If a call fails, we store the error message the upstream service returned, as received and capped at 4,000 characters, so the reason a call failed is actually readable. That row is visible only to you, and it can quote your own data. Separately, before any error message is sent to our analytics provider it runs through a redactor that strips emails, Google Drive IDs, and long quoted strings.
What counts
Not every call is counted the same way:
- Successful calls: counted. Your AI asked Gmail to search, Gmail returned results, you got what you wanted.
- User errors: counted. You asked for a message that doesn't exist, a query with bad JQL, a file you don't have access to. The request reached the API and came back with a legitimate "no."
- Server errors: not counted. If our gateway is down, a plugin crashes, or an upstream API has a 5xx outage, that's not your problem and we don't meter it.
Calls you make from the dashboard are counted under the same rules as calls from an MCP client.
A read that Google refuses for too many requests at once is tried again inside the same call. However many attempts that takes, it is one call here: one row, counted once.
Your plan, payment method and invoices
These live on the Billing page, datatorag.com/dashboard/billing, which is Billing in the dashboard's left rail.
- Plan. The three plans are shown side by side and yours is marked "Current plan". On Free, the Pro card has Upgrade to Pro. On Pro, your card has "Manage or cancel" and the Free card has "Downgrade"; both open the Stripe billing portal, where the change is made. If you cancel, Pro stays active until the end of the period you have paid for.
- This period. Two meters: "Tool calls" and "Agent and skill runs", each against your plan's allowance, with the date the allowance resets. A free account that reaches its tool-call allowance is paused until that date; on Pro, tool calls are not paused past the allowance. Agent and skill runs stop at the plan's number on both plans.
- Payment method. The card on file with its last four digits and expiry. Update opens the billing portal.
- Invoices. Recent invoices with date, amount, status and a PDF link. "All invoices" opens the full list in the billing portal.
Payment method and Invoices are shown once the account has been billed through Stripe. A free account that has never paid sees the plans and the meters only.
The meters on Billing count against your allowance. The Usage page counts every call that was recorded, so the two answer different questions: Billing says how much of the allowance is left, Usage says what ran.
Calls counting on the wrong account
The symptom: you pay for Pro, and an app tells you the free-plan limit is reached, or your usage dashboard looks emptier than it should. The usual cause is two DataToRAG accounts.
DataToRAG makes one account per sign-in email. Each AI app asks you to sign in to DataToRAG once, when you add the connector. If you picked a different Google login in one app than the one that holds your plan, that app is on a second account, usually a free one, and every call it makes counts there.
How to tell. There is no setting inside the AI app that shows which DataToRAG login it uses, so check from the dashboard:
- Sign in at datatorag.com/dashboard. Open the account menu at the bottom of the left rail; the email you are signed in with is shown inside it. The rail itself shows your name, which can be the same on both accounts. Billing shows that account's plan.
- Make one tool call from the app you are checking, for example "search my email for invoices".
- Open Usage. If the call is there, the app is on this account. If it is not, sign out, sign in with your other Google login, and look again. The account where the call appears is the one that app uses.
If the app's call is refused with a message that the monthly free-plan limit is reached, that already answers it: the app is on a free account.
The fix, per app. Three steps, in the app that is on the wrong account:
- Remove the DataToRAG connector.
- Add it back, with the same URL,
https://datatorag.com/mcp. - When Google's account chooser appears, sign in with the email that holds your plan.
In Claude on the web and Claude Desktop, go to Customize, then Connectors, open the menu next to DataToRAG and choose Remove, then add it again as a custom connector the way the setup guide shows. In Claude Code:
claude mcp remove datatorag
claude mcp add --transport http datatorag https://datatorag.com/mcp
Then run /mcp inside Claude Code and sign in when it sends you to the browser. Use the name you gave the server if it is not datatorag. Removing the server also deletes its saved sign-in, so Claude Code asks you to sign in again.
Do not tidy up by disconnecting. It is tempting to open the account you are leaving and disconnect your Google account there. Don't: when the same Google account is connected under both logins, disconnecting it under one can break it under the other, and you would have to reconnect it. Re-adding the connector is the whole fix. The unused account can simply be left alone.
Calls already made under the other account stay in that account's usage history. They are not moved.
Retention
Raw events are kept for 90 days. After that they're replaced by daily rollups: one row per day per tool with call count, error count, and latency percentiles. The rollup job runs every night at 02:00 UTC.
This means you can always see the shape of your usage going back, but we're not holding onto per-call detail forever.
Rate limits
Dashboard API requests are limited to 120 per minute per user. If you hit that, you'll get a 429 with a Retry-After header telling you how long to wait. Tool calls through the MCP endpoint aren't limited by this; the rate limit only applies to the dashboard's own read APIs.
Privacy
- Usage records store the tool name, connected account, outcome, timing and request/response sizes. They do not store request arguments or response bodies.
- Error messages are stored as received, capped at 4,000 characters, so you can debug them, in a row only you can see, and are redacted before they reach our analytics provider
- Every row is scoped to your user ID, other users cannot see your data
- Conversations in the in-product agent are stored separately and DO include your messages and tool results. Delete a thread to remove it.
- To delete your account and everything with it, email [email protected]
Frequently asked questions
Do failed tool calls count against my usage? #
I pay for Pro, so why are my calls counting on the free plan? #
What does DataToRAG record about each tool call? #
How long is my usage data kept? #
Is there a rate limit? #
Can other people see my usage data? #
What does the usage dashboard show? #
Try this on your own account
Connect a service once and your assistant can run every tool on this page against your real data. Free to start, no card.
Get started freeBy continuing you agree to our Terms of Service and Privacy Policy.